Author: Wendy Jackson

College Square Redesign: A Boost for Downtown Athens Commercial Real Estate

The College Square redesign isn’t just a public space improvement—it could be a catalyst for commercial real estate activity in and around the Square. This long-planned effort, led by the Athens Downtown Development Authority (ADDA) in partnership with the Athens‑Clarke County Unified Government, takes what has been a pedestrian plaza—originally created during the COVID‑19 pandemic and now permanently closed to car traffic—and turns it into a vibrant people‑focused public square. 

What’s Changing at College Square

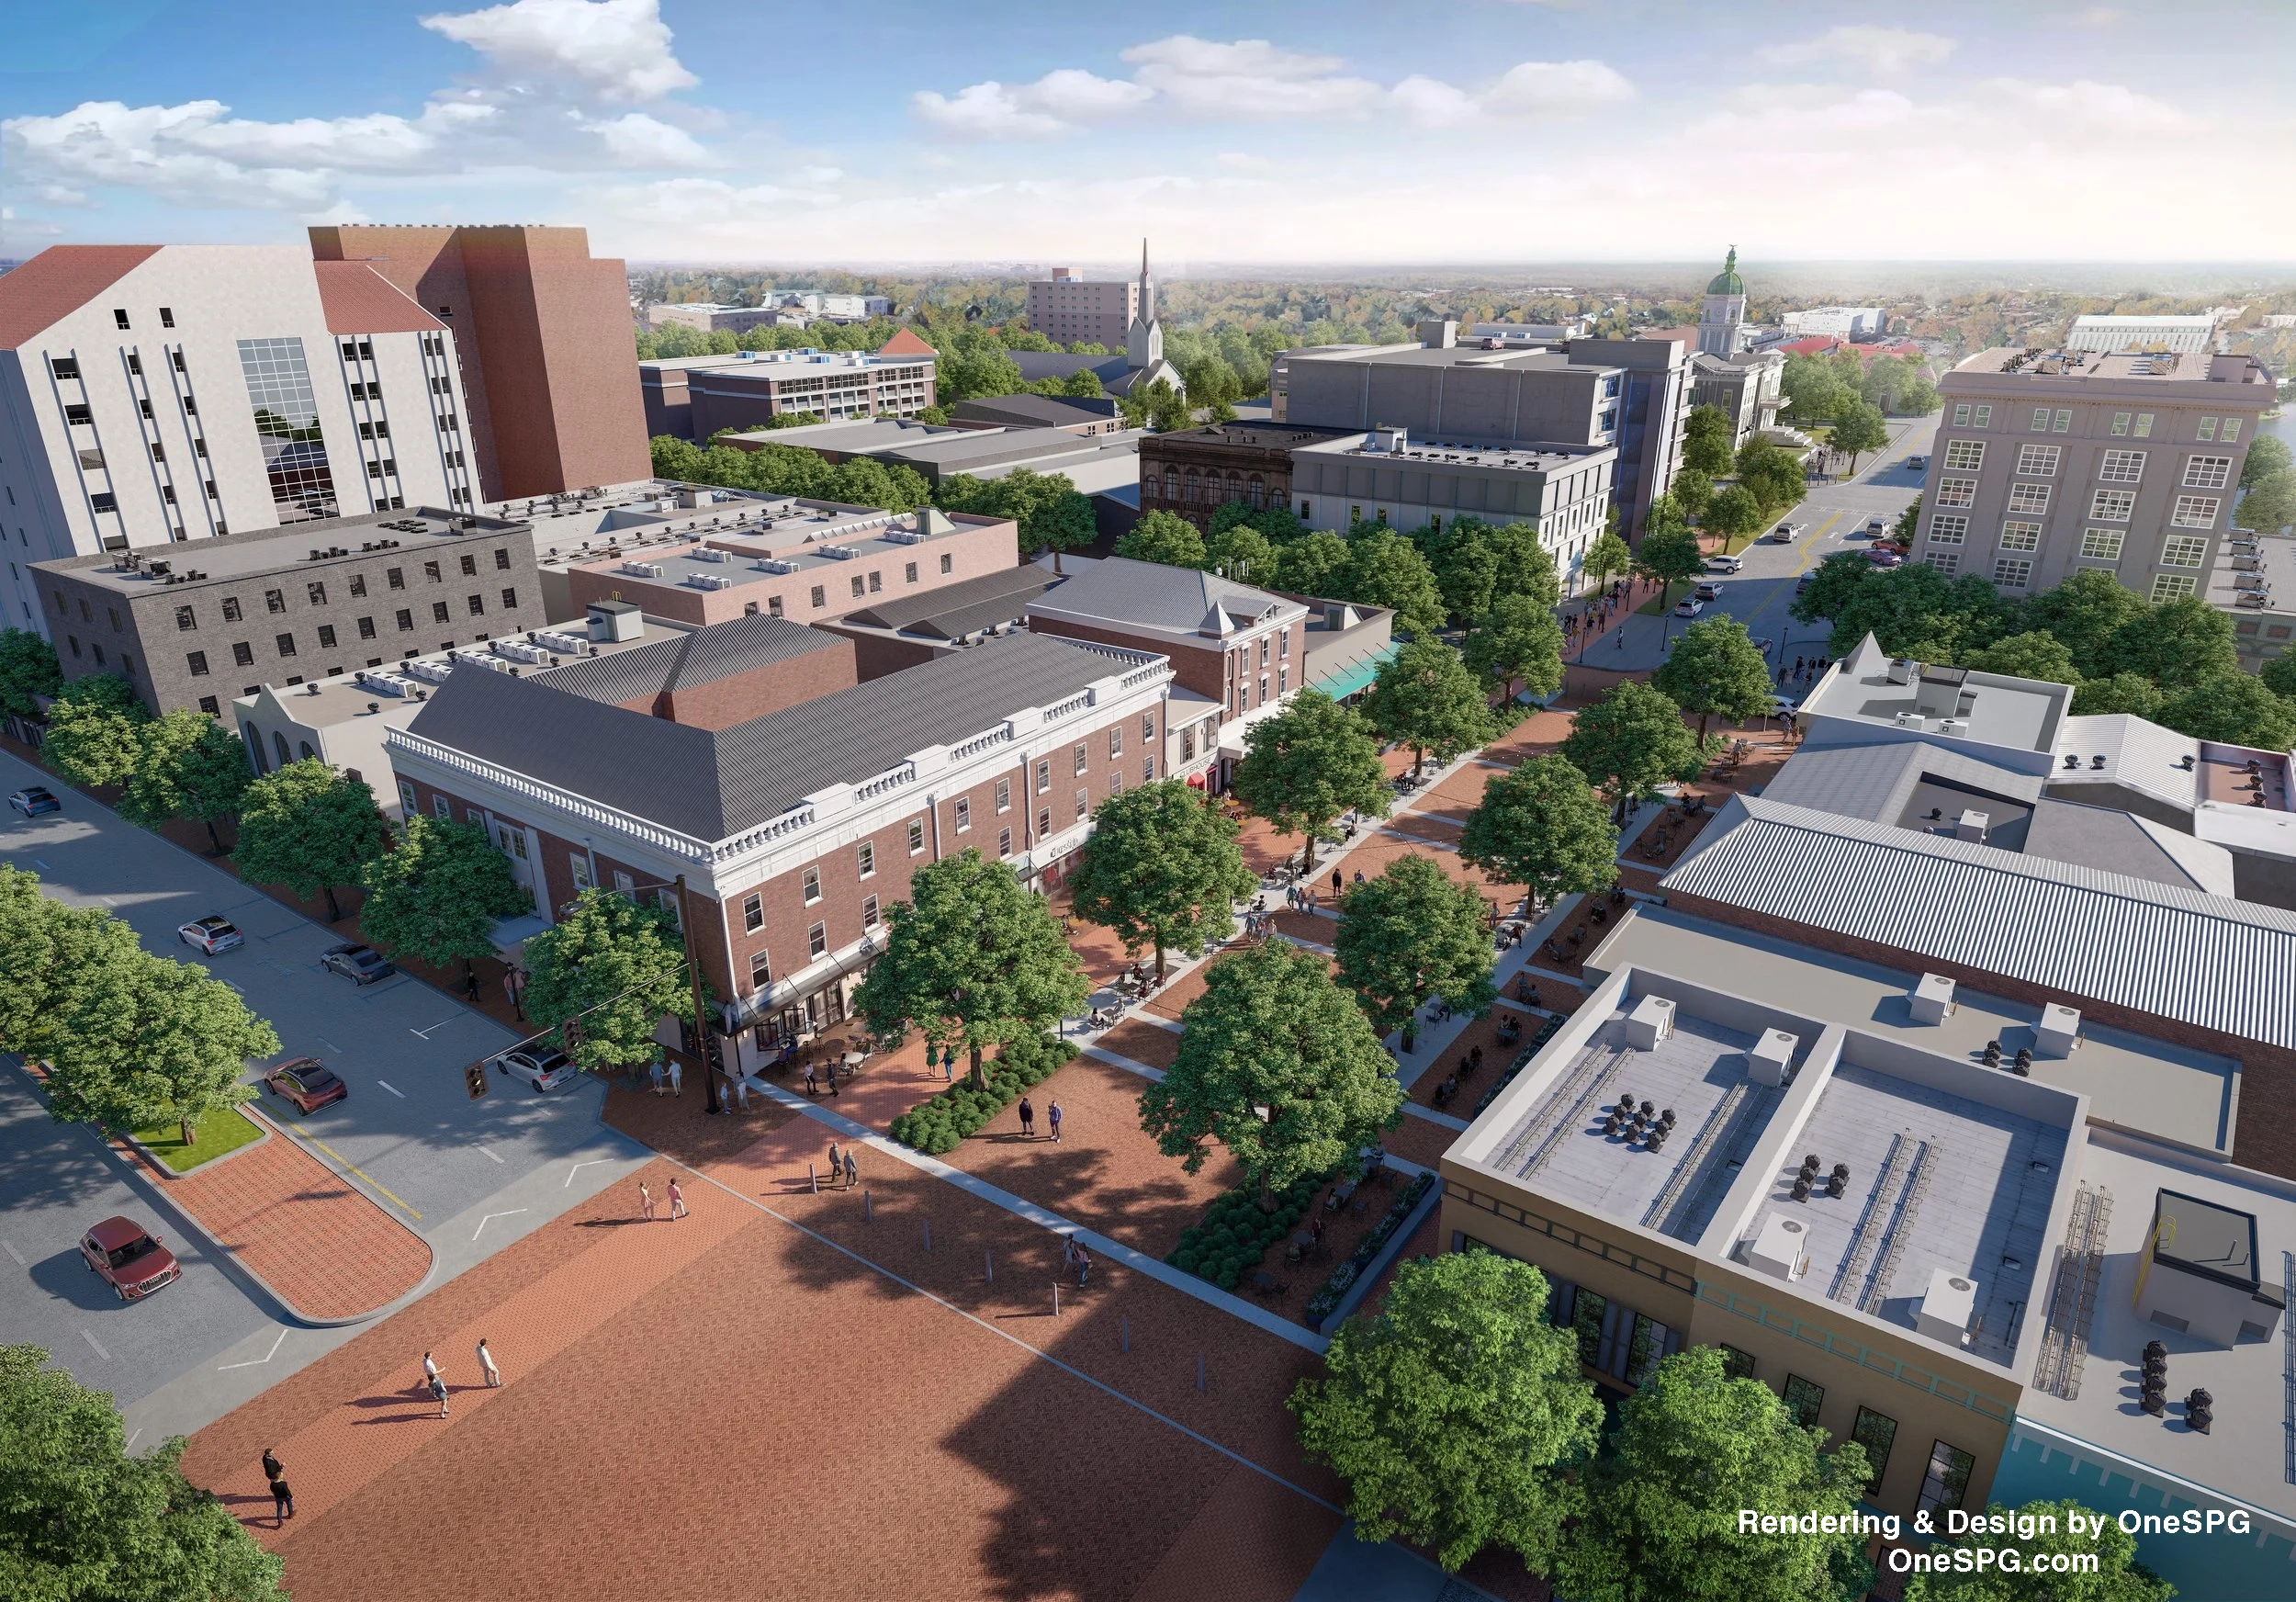
Instead of asphalt and cars, the redesigned space will feature:

  • Brick pavers, expanded seating, and shade structures
  • Enhanced lighting, landscaping, and large trees
  • Improved ADA accessibility and pedestrian circulation
  • Public spaces for events like markets, live music, pop‑ups, and festivals

Officials describe the project as a kind of “handshake” between UGA’s North Campus and downtown Athens, reinforcing the connection between students, residents, and the city’s vibrant commercial real estate core.

What This Means for Downtown Athens Commercial Real Estate

 The College Square redesign project — a multimillion‑dollar public space overhaul between East Broad Street and East Clayton Street — broke ground in early 2026 and is expected to be substantially complete by September 2026, ahead of the University of Georgia’s football season, with final touches wrapping up by October bringing with it: 


  1. Increased Foot Traffic and Dwell Time
    A more inviting, event‑ready central plaza is likely to draw residents, students, and visitors year‑round. Sustained pedestrian traffic can benefit adjacent restaurants, bars, retail shops, and service businesses — all of which are key drivers of downtown commercial real estate demand.
  2. Higher Visibility for Retail and Hospitality Tenants
    Enhanced lighting, improved circulation, and a dedicated space for community gatherings help make nearby storefronts more attractive to customers. This could lead to increased occupancy rates and stronger tenant retention in the blocks surrounding College Square.
  3. Opportunity for Premium Rents and New Development
    Improved public spaces often translate into value creation for nearby properties. As the area becomes a more desirable destination — not just on game days but throughout the year — landlords and developers may see an opportunity to reposition underutilized buildings, seek higher rents, or pursue mixed‑use enhancements
  4. A Stronger Identity for Downtown Athens
  5. By reinforcing College Square as a civic gathering spot that reflects Athens’ culture and character, the project deepens the sense of place that attracts both locals and visitors. A strong place identity can elevate the overall allure of downtown for commercial real estate investors.

How Atlas Real Estate Advisors Can Help

The redesigned College Square is poised to increase property values throughout downtown Athens, creating a wide range of opportunities for commercial property owners. Whether your goal is to create a more profitable asset, optimize tax advantages, improve cash flow, or realize additional value,  Atlas Real Estate Advisors has the local expertise to guide you every step of the way.


Georgia Commercial Real Estate Trends: Why Investors Are Turning to Markets Like Athens

Georgia commercial real estate is starting to shift. While large metropolitan markets like Atlanta remain below their 2022 peaks, smaller cities—including Athens, Augusta, and Macon—are seeing property values rise. Investors are increasingly drawn to these secondary markets, where opportunities are more affordable, less competitive, and often deliver stronger returns.

Data from CoStar shows that lower-priced commercial properties in smaller markets increased 1.3% in January 2026, while investment-grade assets in major cities fell 0.4%. This trend highlights a growing divide between high-priced urban properties and smaller-market commercial real estate.


Key Benefits of Investing in Athens GA Commercial Real Estate

Investing in Athens and other secondary markets offers several advantages:

  • Lower Acquisition Costs: Compared to Atlanta, commercial properties in Athens are more accessible for investors with limited capital, making it easier to enter deals and expand portfolios.
  • Higher Yield Potential: Secondary markets often feature higher cap rates, providing stronger cash flow and income opportunities.
  • Less Competition: Institutional buyers focus heavily on primary markets, leaving smaller cities like Athens with fewer competitors and more deal flexibility.

These factors make Athens an increasingly attractive market for local investors seeking value and stability.


Retail, Office, and Industrial Opportunities in Georgia Secondary Markets

Athens and similar markets are drawing interest across multiple commercial asset classes. Retail centers near growth corridors, office buildings downtown, and industrial facilities on the outskirts of the city all present strong investment opportunities. Areas near the University of Georgia continue to benefit from steady demand, making them ideal for both short-term cash flow and long-term appreciation.

For investors, secondary markets like Athens allow for portfolio diversification, including retail, office, and industrial properties that are often unattainable or overpriced in Atlanta.


Market Trends and Transaction Activity in Georgia

Georgia’s commercial real estate market is seeing renewed activity. Repeat-sale transactions across the state totaled $146.8 billion, a nearly 20% year-over-year increase. Smaller-market properties in Athens and other secondary cities are selling at roughly 92.5% of asking price, showing that buyers still have leverage and can secure favorable terms.

This combination of rising values, investor-friendly pricing, and growing transaction volume makes smaller Georgia markets increasingly attractive.


The Bottom Line for Athens Investors

The commercial real estate landscape in Georgia is no longer defined solely by Atlanta. Secondary markets like Athens offer lower acquisition costs, stronger yield potential, and less competition—creating attractive opportunities for both new and experienced investors. For those looking to diversify their portfolios or identify emerging investment opportunities, Atlas Real Estate Advisors can help uncover promising smaller markets across Georgia that may represent the next wave of commercial real estate growth.


Investment Metrics: Cap Rate, IRR, and ROI

When evaluating investment opportunities—especially in real estate or longer-term projects—knowing how to interpret key metrics is critical. Cap rate, IRR, and ROI each give you a different lens through which to view a deal’s attractiveness and risks. Below is a breakdown to help demystify these terms and show how to use them together.

Cap Rate (Capitalization Rate)

What it is:
The cap rate is a snapshot metric. It represents the expected annual return on a property (before financing) based on its net income and current market value. In formula form:

Cap Rate = Net Operating Income (NOI) ÷ Property Value

Here, NOI is the annual income from the asset after subtracting operating expenses (maintenance, taxes, management, insurance, etc.), but before accounting for debt service or tax impacts.

Why it matters:

  • It gives a quick, apples-to-apples comparison of earnings potential across properties in different markets or asset classes.
  • A higher cap rate usually implies higher risk (or undervaluation), while a lower cap rate suggests greater stability or premium pricing. 
  • Because the cap rate ignores financing, it’s a useful “unleveraged” benchmark. 

Cap rate is limited in that it only reflects first-year performance and does not account for future growth, potential changes in income, or expected resale value. Additionally, it ignores factors such as debt, capital expenditures, and the timing of cash flows, providing only a snapshot of the property’s immediate yield rather than a full picture of long-term performance.

IRR (Internal Rate of Return)

What it is:
IRR is a more holistic, time-adjusted metric. It solves for the discount rate at which the net present value (NPV) of all cash flows—both inflows and outflows over the life of an investment—is zero. In practical terms, it’s the compound annual return that an investor would earn, given projected cash flows and eventual sale value.

Why it matters:

  • IRR incorporates when cash flows occur, not just the totals. So early returns are more valuable than late ones.
  • It accounts for resale or terminal value, making it useful for comparing multi-year investments.
    It can be computed with leverage or without, enabling comparisons of financed vs. all-cash structures.

The IRR metric comes with a few important limitations. It assumes that interim cash flows can be reinvested at the same IRR, which is often unrealistic—a concept known as the “reinvestment assumption.” IRR is also highly sensitive to the assumptions built into projections, such as growth rates, terminal value, and the timing of an eventual exit. Additionally, it can be difficult to compare projects of varying durations or those with irregular cash flows, since the timing and pattern of returns may distort the results.

ROI (Return on Investment)

What it is:
ROI is the simplest and most general measure. It tracks how much you gained (or lost) relative to the cost of the investment, typically expressed as a percentage:

ROI = (Gain from Investment – Cost of Investment) ÷ Cost of Investment 

Alternatively, for more precise tracking:

ROI = (Final Value – Initial Value) ÷ Initial Value 

Because it usually measures one overall period, ROI doesn’t inherently account for the timing or compounding of returns.

Why it’s useful:

  • Straightforward and easy to communicate—especially for short-term or single-period investments.
  • Useful as a benchmark metric for quick comparisons across asset types.

ROI has its limitations as well. Most notably, it does not account for the time value of money—a 50% return over one year is very different from the same return over five years, yet raw ROI treats them equally. It can also obscure important factors such as risk, capital structure, and variations in interim cash flows. Furthermore, ROI does not take financing, inflation, or opportunity costs into consideration, which can lead to an incomplete picture of an investment’s true performance.

How These Metrics Work Together

To get the fullest picture, savvy investors don’t rely on just one metric. Here’s how they interplay:

  • Cap Rate gives you a baseline “snapshot” of property yield at a given moment, ignoring financing or growth assumptions.
  • IRR adds the dimension of time, growth, exit strategies, and cash flow variability.
  • ROI gives the raw return over a given period in a simpler form, useful for quick comparisons or high-level analysis.

In practical terms, when evaluating a potential investment, you might start by using the cap rate to quickly filter properties based on their income yield. From there, running a pro forma cash flow model can help project revenues, expenses, and anticipated exit values, providing a clearer picture of the property’s financial performance over time. Next, calculating the IRR allows you to assess whether the long-term return meets your target or hurdle rate. Finally, computing ROI can serve as a quick sanity check or internal benchmark, giving a straightforward view of the overall return relative to the investment cost.

Cap rates, IRR, and ROI each serve as useful lenses on an investment—but none are perfect alone. The most disciplined investors will use them in concert, cross-checking results and stress-testing assumptions. If you’d like help building a cash flow model or running scenario analysis using these metrics, Atlas can assist. We can tailor projections, stress-test assumptions, and help you compare deals side by side—so you can make informed decisions with confidence.

How Banks Underwrite Commercial Real Estate Loans

As we step into 2025, the commercial real estate (CRE) lending landscape is evolving—marked by stabilized interest rates and a resurgence in financing activity. But behind every loan decision lies a rigorous underwriting process that determines whether a deal goes through.

Underwriting: A Three-Dimensional Analysis

When a bank underwrites a CRE loan, it’s evaluating three core pillars:

  • Borrower Creditworthiness – including personal and business credit histories, net worth, liquidity, and performance track record.
  • Property Viability – encompassing income potential, market demand, location dynamics, and collateral value.
  • Market Risk & Financial Metrics – Together, DSCR, LTV, and debt yield give lenders a multidimensional view of loan risk:

How?

The DSCR (debt service coverage ratio) determines whether or not the property can generate sufficient income to service debt. The LTV (loan to value) will indicates how much equity the borrower has at stake by calculating the loan amount divided by property value. The debt yield will calculate the property’s income compared to the loan amount and provide the bank a safeguard against market volatility, independent of interest rates.

Lenders use these metrics to balance market risk and financial risk, ensuring they make informed lending decisions even in uncertain economic conditions.

What Makes a Strong Candidate in 2025?

In today’s commercial real estate lending environment, borrowers who demonstrate financial stability and operational experience are more likely to secure favorable loan terms. Key factors that make a borrower a strong candidate include:

Solid Credit Profile: A high credit score and low personal debt-to-income ratio signals reliability to lenders. While some alternative or non-bank lenders may consider lower credit scores, borrowers should expect higher interest rates, increased fees, or tighter loan terms if credit falls below traditional thresholds.

Substantial Equity or Liquidity: Lenders favor borrowers who bring meaningful capital to the table. The amount varies depending on the type of investment, but lenders want to be assured that borrowers have reserves to weather market volatility or unexpected expenses.

Strong Cash Flow Metrics: A Debt Service Coverage Ratio (DSCR) over 1.0 indicates that the property generates sufficient net operating income to cover the debt obligations. Lenders often want to see 1.25 or more to be comfortable, depending on the borrower and asset. Properties with strong, stable cash flow reduce lender risk and increase the likelihood of approval.

Relevant Experience: Banks and institutional lenders value prior operational experience, management expertise, or a history of successful property ownership. This is particularly critical for larger loans, specialized asset types (like industrial or mixed-use), or complex financing structures.

Financial Documentation and Preparedness: Delivering an organized, transparent financial dossier is essential. Borrowers should be prepared to provide:

  • Tax returns
  • Financial statements
  • Copy of purchase contract
  • Appraisal reports
  • Rent rolls or lease schedules
  • Environmental site assessments
  • Surveys or engineering reports
  • Operating history documentation
  • Proof of cash reserves
  • Business plan or investment strategy

Emerging Market Dynamics in 2025

Several factors are reshaping commercial real estate lending this year, creating both opportunities and challenges for borrowers:

Refinancing Surge: Nearly $1 trillion in commercial mortgages mature in 2025, driving strong refinancing demand. While this opens opportunities for well-prepared borrowers to secure favorable terms, it also creates stress for those with weaker financials or properties that need repositioning.
Regulatory Tightening: Some lenders are increasing due diligence for income validation, occupancy verification, and fraud prevention. Borrowers with clean, verifiable financials and responsive documentation are more likely to navigate approvals efficiently.
Property Type Considerations: Lenders continue to favor properties with stable cash flow and strong fundamentals, including multi-family, well-located industrial, and Tier-A office assets, while older or distressed office stock faces tighter scrutiny.

While traditional banks tighten credit, smaller regional or community banks can often fill the gap by offering more personalized and flexible lending solutions.  Smaller/local institutions will often take a creative approach to structuring loans by tailoring terms to accommodate unique assets, specialized uses, or complex financing scenarios that larger lenders may avoid. John Loftis, Senior VP and commercial lending executive at First American Bank and Trust in Athens, says, “We don’t try to fit our clients into any particular box, but more so build the box around them individually.”

By understanding the rigorous underwriting process and presenting organized documentation alongside strong cash-flow properties, you can position yourself as the preferred candidate in any lender’s pipeline. At Atlas Real Estate Advisors, our team leverages extensive experience to guide borrowers and investors through complex financing scenarios, helping secure optimal terms and navigate evolving market conditions with confidence.


Opportunity Zones: Navigating the “One Big Beautiful Bill Act”

On July 4, 2025, President Trump signed the “One Big Beautiful Bill Act” (OBBBA), which makes the Opportunity Zone (OZ) tax incentives permanent and introduces a suite of strategic updates. Originally part of the Tax Cuts and Jobs Act of 2017, the OZ framework—which channels capital gains into investments in low-income communities—has now been institutionalized, opening a new era for investors and developers alike. This bill updates, improves, and revitalizes the Opportunity Zone program to ensure it truly benefits low-income communities while remaining attractive to investors.

Key Changes in a Nutshell

Permanent Program, Revised Timeline
The OZ program, once set to expire in 2026, has now been made permanent. Beginning in 2027, a streamlined deferral and exclusion timetable kicks in: a five-year window to defer gains, a 10-year holding period for final tax exclusion, and a frozen step-up in basis at 30 years 

Better Incentives in Rural Areas
The OBBBA introduces “Qualified Rural Opportunity Funds.” These investments offer a 30% step-up in cost basis after five years and reduce property improvement requirements from 100% to 50% in rural zones 

Redesignation of Zones
Starting July 1, 2026, OZ designations will be refreshed periodically to ensure compliance with evolving socioeconomic conditions. Eligibility criteria are stricter: 70% of area or state median income (down from 80%), a minimum 20% poverty rate, and the removal of contiguous tract exceptions

Enhanced Reporting & Enforcement
The OBBBA brings in layered reporting mandates.. Funds now must file timely elections, even in the absence of income—failure to do so could trigger expensive corrective processes.

Overall Tax Benefit Curve
The removal of a 2047 sunset means a permanent 30-year window for gain exclusion. Any investment held beyond that receives a step-up in basis and continued tax exclusion


What This Means for Investors

  • Long-term clarity, short-term urgency: The program’s permanence allows for extended planning, but investors should consider capitalizing on current rules before year-end 2026 to benefit from the existing, richer timeline.
  • Rural investments = better returns: The enhanced terms for rural OZ funds create compelling upside for developers in farming, energy, and small-town revitalization.
  • Compliance is more crucial than ever: The expanded reporting requirements mean that missteps can be costly. Accurate fund administration is now essential.


Atlas Can Help You Form a Strategy

Timing Considerations

  • 2025–2026: Deploy capital before year-end to lock in the 5-, 7-, and 10-year benefits of the original rules.
  • 2027 onward: Shift to long-term plays under the new framework, especially via rural OZ funds.


Rural OZ Research
Deploy deep-market research into qualifying rural tracts, especially for sectors like housing, energy, agribusiness, and rural healthcare. The lower improvement thresholds and richer tax advantages make these corridors particularly attractive.

Compliance & Reporting 

Given heightened IRS scrutiny and new forms, partner with compliance experts—to manage filings, audits, and fund oversight.

Zone Requalification
Track census data and maintain adaptability. Pivot options or secondary-site eligibility assessments could protect investment value in case of decertification.

Final Take

The OBBBA cements Opportunity Zones as a permanent, tax-smart vehicle for forward-thinking real estate investment. With richer incentives—especially in rural tracts—paired with enhanced oversight, the landscape is both promising and demanding.   Atlas Real Estate Advisors is positioned to guide investors and developers through this new environment—combining timing acumen, rural expertise, compliance rigor, and strategic flexibility to maximize OZ potential across evolving communities.


*This blog post is for informational purposes only and does not constitute legal, tax, or investment advice. Investors should consult with a qualified tax advisor, accountant, or legal professional before making any investment decisions or taking action based on the information provided.

Commercial Market Momentum in Georgia

Midway through 2025, the Georgia commercial real estate market is gaining traction—and investors in markets like Athens and Northeast Georgia are in a strong position to capitalize on this momentum. 

According to the June 2025 Capital Markets Compass by Colliers, transaction activity is rising again. Industrial sales volume is up 6% year-over-year, while retail activity climbed 20%. Pair this with improved financing conditions—10-year Treasury yields around 4.4% and fixed rates below 7%—and investor confidence is clearly returning.

Industrial in Georgia: On the Rise

Georgia continues to be a magnet for industrial investment, with Atlanta named a top-performing logistics market. But that growth is expanding outward. Here in Athens and surrounding regions, we’re seeing increasing demand for smaller-scale warehouse, manufacturing, and flex properties—especially those within reach of I-20, I-85, and regional economic hubs.

Atlas has been actively involved in this shift. One example is our acquisition and repositioning of 4304 Sudan Dr. in Augusta, a 75,000 SF industrial facility that had been underutilized. We stabilized the asset, implemented professional management practices, and quickly filled it with high quality tenants. 

Retail & Multifamily: Holding Steady

Retail and multifamily are also gaining ground. CMBS default rates in retail have dropped nearly 20%, and well-located centers—especially in university and suburban markets—are seeing stronger leasing activity. Multifamily continues to lead all sectors globally in capital investment, reflecting long-term demand and confidence in the housing sector.

What This Means for Investors

If you’re active—or plan to be—in  commercial real estate, now is a smart time to reevaluate opportunities. At Atlas, we’re working with:

  • Users searching for affordable industrial or retail space with strategic access for their business
  • Investors acquiring or repositioning cash-flowing and appreciating assets across the Southeast
  • Developers preparing to bring adaptive reuse or new construction projects to market

In Closing

With Georgia’s market strengthening across key sectors and investor sentiment improving, the window to buy, reposition, or lease strategically is open. Atlas is helping clients uncover value and move forward with confidence. Let’s talk about what’s next for your portfolio.


Experience the Atlas Real Estate Advisors difference.

Contact us today for personalized, expert advice in commercial real estate.
Let us help you navigate your real estate journey with confidence and success